|
I'm back at it again! This past fall semester (Fall 2019) I successfully completed my Digital Humanities certificate! My mapping project was my capstone project, and the new and improved map is up on this website! I also did two blog posts last semester. Both are hosted on the University of Iowa's DH Studio blog. The first post, titled "Back At it aGenji" discusses my work as of halfway through the semester. In this post, I clarify my categories, discuss hierarchy of locations and what I was aiming to achieve for the project that semester.
My second post "Points on a Map" talks about my "final" product for the semester, and the process that got me there. That being said, it's a new semester so there's new things in the works for this project! This spring I'm focusing on my translation thesis, so I'm slowing down a bit on my Genji work. But I'm not stopping! I'm taking a(nother) Tale of Genji course where my professor is graciously allowing me to design an assignment for her students that looks at using the map and text in conjunction together to do textual analysis. I am hoping to utilize and synthesize the information that the students find and incorporating it into a Location Dictionary specific to my map. I will be presenting on this project at the Association of Asian Studies (AAS) conference in March on the digital humanities lightning panel (Saturday, March 21st (2020)).
1 Comment
My second blog/vlog post is up and accessible here!
I've reached the final few days of the official fellowship and I've managed to comb through 90% of the text. While not my original goal for the summer, I definitely underestimated how much time it would take to look closely at the text and do data entry. I'm still very pleased with what I did manage to accomplish as I know it's important to set up a solid foundation for my work before I continue to work on the visualization aspect. This summer I've been participating in the University of Iowa's Digital Scholarship and Studio Summer Fellowship! I've written one blog post about my experience so far and you can read that here!
My primary focus for this summer has been the digital map and most of my time has been data entry from the text into an Excel spreadsheet (as shown in my first post about the map). While I underestimated just how much time I would spend looking at the text this summer, it's been a wonderful opportunity to knock out this critical portion of the project so I can get on to the visualization portions. I've got another Studio blog post going up tomorrow and will link to that in a separate post! Hi all, I'm implementing a blog here so that I can track my progress/make the site as a whole more scholarly, as I'm preparing to use this as my Digital Humanities graduate certificate capstone project. This semester I'm in an information visualization class within the SLIS department. I was super excited since it seemed like it was going to be a great overview/introduction to different types of visualization, since I'm only really familiar with QGIS ArcGIS, and, obviously, the Google Mapping format that I'm using for this website. However, that has not been what this class is. It's exclusively coding with d3 and JavaScript, making primarily varieties of circles. I legitimately do not understand any of it. The last coding I did was HTML on my Neopets profile, and the Professor just dropped us right in the middle of fairly advanced things without any sort of introduction. So, after like 12 weeks of absolute suffering and really lackluster assignments, I asked the Professor about doing a digital mapping project for the term project. He was willing to allow me to do that. I was thrilled, finally, I'll get to present the work I've done on the map! The first map I made was through QGIS, however that's hosted only locally on my computer and not able to be embedded in a meaningful and interactive way, it would only be a static picture, as below. 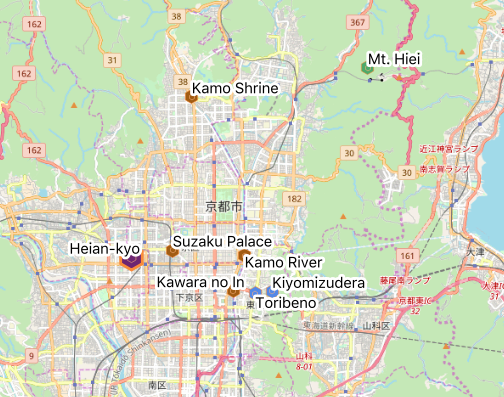 While nice, not exactly thrilling, or interactive, or particularly legible for that matter. Admittedly, the Google Map is still in its initial stages, it only has about 30 locations and the layers/included information are fairly wonky. BUT I'm pretty proud of it, especially since I wasn't totally sure I would be able to embed it effectively into the site. Well, Professor was Not Impressed. I've put too much time into it, why don't I just write a python script to scan the book for location names, who would even use this, is the text even taught in classes, what do the different colors mean, how is this going to work with your DH certificate, etc etc etc. Needless to say I'm fairly crushed. While I understand that things need improvement, I think it's rather unfair to 1) assume that this text is pointless and I'm wasting my time and 2) holding everyone to the same coding capabilities. He did, however, raise some good points. I think I do need to limit what's visible when zoomed out from the map. Obviously I'm going to be amending the layers so that each different type of location is a different layer and can be toggled on and off. I'm also going to be working with shapes to define things like "plains" and "moors" that don't really have one singular location but are instead large areas. I've also been asking myself what the purpose of visualizing this information is. Primarily I think it's important to realize that While The Tale takes place primarily within the capital, the government had a wide reaching influence, especially since the emperor was assigning men to far off provinces to serve as governor. In addition to that, utamakura were frequently referencing locations that were extremely far from the capital, so being able to visualize that is helpful for understanding the literature of the time. I will continue combing through the text by hand because 1) I enjoy it and 2) I think it's important to get as many details as possible about these locations, especially since the text is so old. Below, a snapshot of some of the columns I have going in my excel spreadsheet of location data. The orange highlighted rows are new additions that don't have longitude/latitude yet. 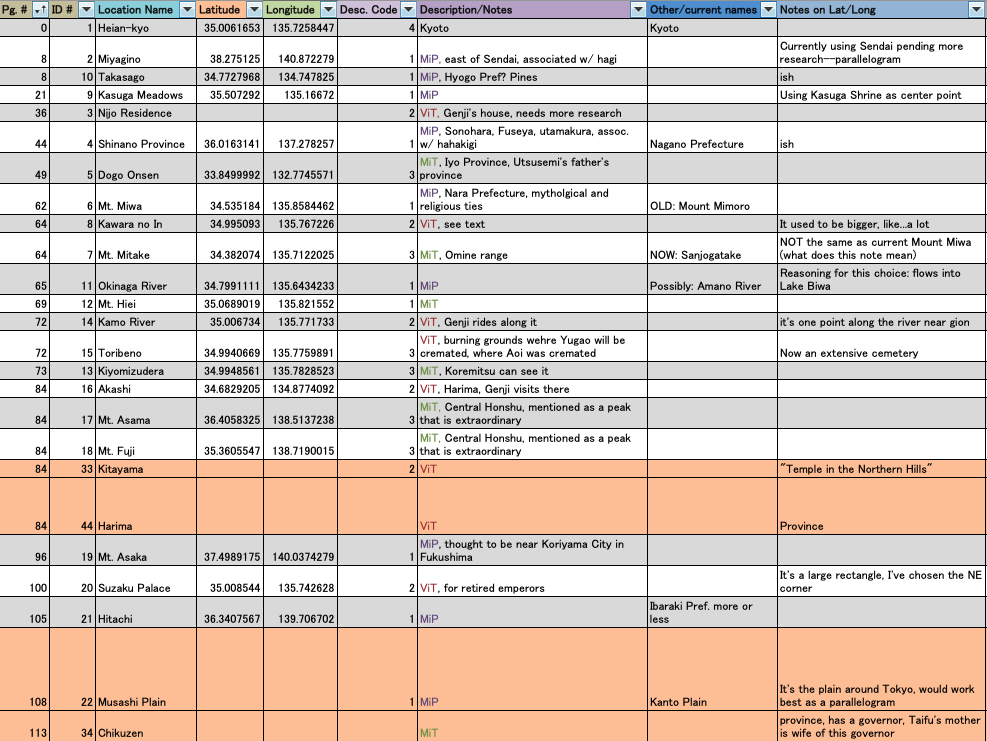 |
 RSS Feed